Introduction: The Evolution of Breast Cancer Risk Assessment
For decades, the global medical community faced a significant hurdle in oncology: how to accurately predict who will develop breast cancer before the first abnormal cell even forms. Historically, clinical strategies relied on a rigid, reactive approach. Mammograms were scheduled strictly by age thresholds, and risk estimation was limited to basic checklists. However, cutting-edge molecular science has completely dismantled this “one-size-fits-all” narrative. We have officially moved away from these historical constraints and entered the modern era of personalised, predictive medicine. Today, understanding your long-term health is no longer a guessing game; it is an exact science driven by sophisticated algorithmic mapping.
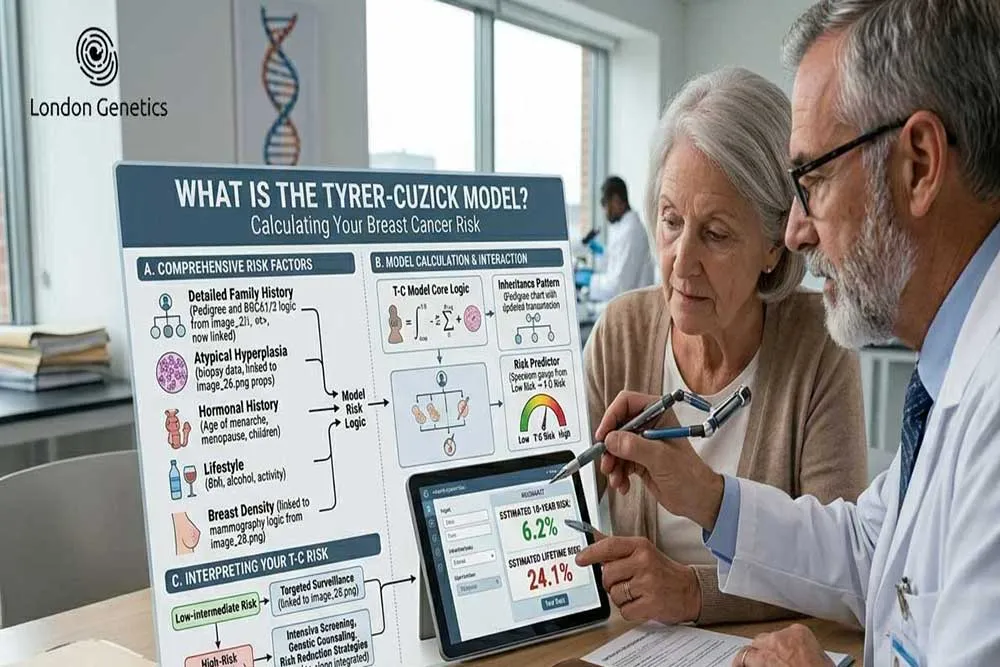
At the absolute forefront of this clinical evolution is the Tyrer-Cuzick model. Unlike early statistical tools that merely scratched the surface, the Tyrer-Cuzick framework allows clinicians to look from the inside out, seamlessly combining a patient’s lifestyle factors with deep hereditary data. This comprehensive methodology bridges the gap between traditional epidemiology and modern diagnostics, transforming how we identify high-risk individuals.
                  ┌────────────────────────────────────────┐
                  │   The Breast Cancer Screening Shift    │
                  └───────────────────┬────────────────────┘
                                      │
         ┌────────────────────────────┴────────────────────────────┐
         ▼                                                         ▼
┌─────────────────────────────────┐               ┌─────────────────────────────────┐
│     Traditional Screening       │               │    The Tyrer-Cuzick Approach    │
│ • Age-only mammogram triggers   │  VS (Advance) │ • Multi-generational pedigree   │
│ • Ignores complex family trees  │               │ • Breast density integration    │
│ • Reactive "wait-and-see" model │               │ • Proactive chemical prevention │
└─────────────────────────────────┘               └─────────────────────────────────┘
The true power of integrating the Tyrer-Cuzick model into routine oncology workflows lies in its ability to pinpoint silent vulnerabilities. When a woman has a complex family tree, evaluating her probability of disease requires looking past basic timelines and diving directly into a comprehensive genetic risk assessment. By mapping out the precise convergence of inherited factors, hormonal histories, and lifestyle biomarkers, this sophisticated tool empowers healthcare providers to design bespoke surveillance roadmaps. Ultimately, this clinical evolution ensures that every patient receives the exact level of diagnostic clarity they deserve, safeguarding their health years before a physical symptom ever manifests.
The Mathematical Engine: What Is the Tyrer-Cuzick Model?
To accurately calculate a woman’s objective likelihood of developing breast cancer, clinical oncology must look far beyond singular genetic mutations. The Tyrer-Cuzick model is an advanced, computer-based clinical algorithm that simultaneously evaluates an extensive array of multi-generational, hormonal, and physical factors to replace clinical guesswork with deep statistical precision.
Recognising that the Tyrer-Cuzick model serves as a global gold standard allows clinical teams to construct highly optimised, proactive screening pathways. By moving beyond binary genetic testing and mapping hidden hereditary traits, this algorithm ensures that high-risk individuals are accurately identified, closely monitored, and clinically protected.
The Core Biomarkers: How the Tyrer-Cuzick Algorithm Calculates Risk
The clinical superiority of the Tyrer-Cuzick algorithm lies in its holistic processing engine. It does not treat a patient as an isolated data point; instead, it looks at how multiple, overlapping variables amplify one another. To generate an accurate mathematical percentage, the algorithm requires a detailed input of personal biomarkers. By understanding how these specific breast cancer risk factors interact, the system can draw a remarkably precise picture of an individual’s internal biological environment.
The system breaks down these essential variables into several distinct clinical categories:
-
Hormonal and Reproductive Milestones: Exposure to oestrogen is one of the most critical breast cancer risk factors. The Tyrer-Cuzick algorithm tracks this by analysing the exact age of menarche (a woman’s first period) and the age of menopause. Additionally, it factors in reproductive history, such as the age at first childbirth or whether a woman has never given birth (nulliparity), alongside any history of using Hormone Replacement Therapy (HRT).
-
Physical and Metabolic Biomarkers: A patient’s Body Mass Index (BMI) is heavily weighted within the system. Post-menopausal weight gain directly alters circulating hormone levels, making metabolic health a vital component in modern risk mapping.
-
Atypical Hyperplasia and Benign Tissue Changes: Not all tissue abnormalities are malignant, but some serve as severe warnings. If a patient has a history of breast biopsies, the Tyrer-Cuzick algorithm evaluates the specific pathology report. The presence of high-risk, benign lesions—such as Atypical Ductal Hyperplasia (ADH), Atypical Lobular Hyperplasia (ALH), or Lobular Carcinoma In Situ (LCIS)—significantly elevates the calculated baseline risk.
┌────────────────────────────────────────────────────────────────────────┐
│                    TYRER-CUZICK RISK AMPLIFICATION                     │
├───────────────────────────────────┬────────────────────────────────────┤
│  LOW-AMPLIFICATION VARIABLES      │  HIGH-AMPLIFICATION VARIABLES     │
├───────────────────────────────────┼────────────────────────────────────┤
│ • Normal BMI (<25)                │ • Elevated BMI (>30)               │
│ • Standard Age of Menarche (>12)  │ • Early Menarche (<11)             │
│ • No History of Breast Biopsies   │ • Biopsy showing Atypical Lesions  │
└───────────────────────────────────┴────────────────────────────────────┘
By transitioning away from basic familial checklists and adopting this multi-layered framework, the Tyrer-Cuzick algorithm accounts for the reality that these biological variables do not exist in a vacuum. A single isolated trait might carry a minor consequence, but when the algorithm correlates early menarche with a history of atypical hyperplasia, it uncovers hidden compounding risks. This ensures that women carrying these combined breast cancer risk factors are flagged early enough to benefit from proactive, life-saving clinical interventions.
The Power of Pedigree: Deep-Dive Family History Analysis
While many early clinical tools offered a superficial glance at a patient’s ancestry, the true brilliance of the Tyrer-Cuzick model lies in its sophisticated evaluation of a multi-generational pedigree. Understanding your true oncological risk requires tracing the complex, dynamic flow of inherited vulnerabilities across both maternal and paternal lines to uncover patterns that traditional single-generation checklists completely miss.

Mapping your multi-generational lineage ensures your personal genetic screening protocol is tailored to the exact size, age, and health history of your entire biological family tree.


Key Takeaway:
Analysing the hard science behind multi-generational pedigree risk reveals that ancestral context is just as vital as direct molecular testing. By grading relative proximity, disease onset ages, and family size discrepancies, the Tyrer-Cuzick model replaces blanket risk assumptions with an objective, data-driven framework for your long-term peace of mind.
Breast Density & The Tyrer-Cuzick Model: The Hidden Mammogram Factor
For many years, traditional imaging was viewed purely as a tool for detecting existing lesions. However, modern oncological science has revealed that a mammogram layout contains another critical, hidden piece of data: tissue composition. In contemporary preventive medicine, carrying a high breast density risk is recognised as a major independent variable in oncogenesis. The brilliance of the modern Tyrer-Cuzick model is its ability to integrate this visual, radiological biomarker directly into its mathematical engine, transforming a static imaging result into a dynamic forecasting tool.
Breast density refers to the relative proportion of glandular and fibrous connective tissues compared to fatty tissue within the breast. Within the Tyrer-Cuzick model, this composition is factored in using precise clinical gradings, typically aligned with the BI-RADS (Breast Imaging-Reporting and Data System) categories:
-
The Masking Effect: Highly dense tissue appears white on a mammogram, which is the exact same appearance as a potential malignancy. This structural overlap can effectively mask early-stage tumours, delaying crucial diagnoses.
-
Independent Biological Risk: Beyond simply hiding abnormalities, dense tissue contains a higher concentration of epithelial cells and specialized stroma—the exact areas where malignancies originate. Therefore, a high breast density risk actively multiplies the cellular probability of cancer formation.
┌────────────────────────────────────────────────────────────────────────┐
│                    MAMMOGRAPHIC DENSITY CONVERSIONS                    │
├───────────────────────────────────┬────────────────────────────────────┤
│  FATTY INVOLUTION (LOW RISK)      │  EXTREMELY DENSE (HIGH RISK)       │
├───────────────────────────────────┼────────────────────────────────────┤
│ • Transparent on Mammogram        │ • Opaque/White on Mammogram        │
│ • Lesions easily identified       │ • Coordinates severe Masking Effect│
│ • Decreases Tyrer-Cuzick Baseline │ • Strongly elevates final Score %  │
└───────────────────────────────────┴────────────────────────────────────┘
When a specialist enters a patient’s automated volumetric density percentage into the Tyrer-Cuzick model, the algorithm immediately adjusts the baseline calculations. If a woman possesses a low-risk family tree but displays an extremely dense tissue pattern, the system recognizes that her personal hazard is higher than her lineage suggests. By correlating a high breast density risk with her broader metabolic profile, the algorithm prevents high-risk women from slipping through the cracks of standard age-based screening protocols, ensuring they are directed toward more sensitive imaging options.
Decoding Your Score: What Does a High Tyrer-Cuzick Percentage Mean?
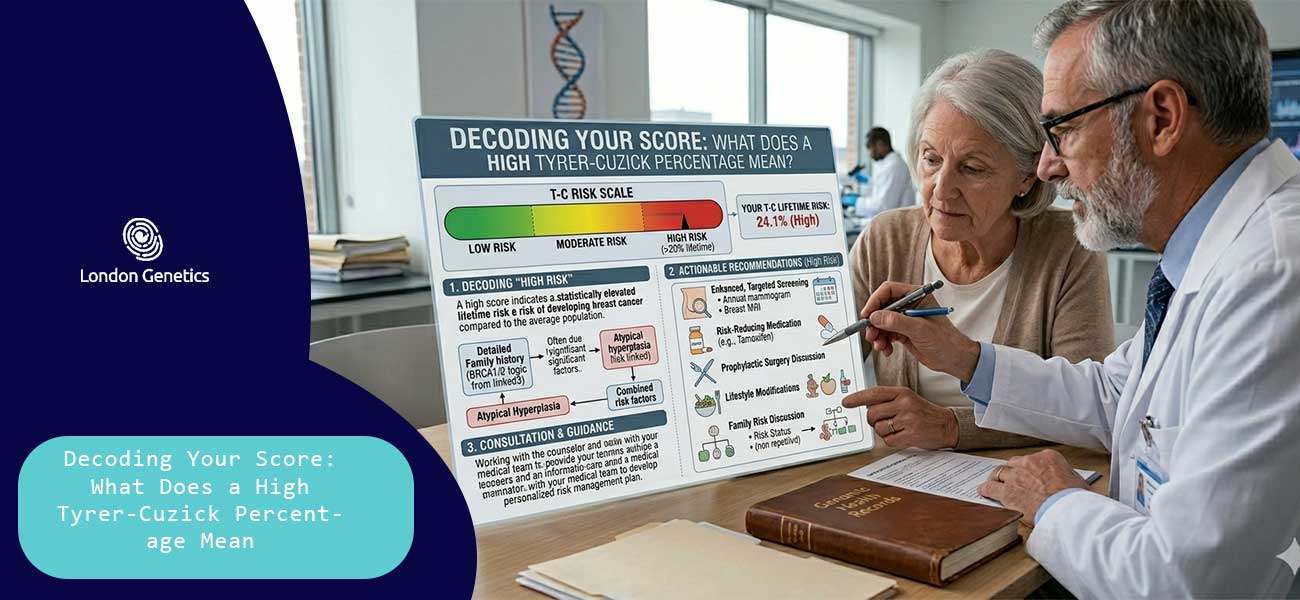
Receiving a clinical report containing a personalized risk assessment can naturally evoke a sense of anxiety. For many women, looking at a statistical matrix filled with mathematical probabilities leaves them asking one vital, pressing question: what is a high Tyrer-Cuzick score? To understand these numbers, it is essential to realize that the output is not a definitive diagnosis; it is a clinical compass. The final Tyrer-Cuzick percentage provides an estimate of your probability of developing breast cancer compared to the general population, allowing specialists to move away from generic guidelines and implement custom surveillance strategies tailored precisely to your risk tier.
Clinicians globally divide the lifetime risk results generated by the algorithm into three distinct, actionable categories:
-
Average Risk (Under 15%): A lifetime Tyrer-Cuzick percentage below 15% places an individual in the baseline category. This means your risk aligns closely with the general population. For women in this bracket, standard UK national screening protocols—such as routine mammograms every three years starting at age 50—are typically considered highly effective and sufficient, provided no new family health changes occur.
-
Moderate/Intermediate Risk (15% to 20%): If your score falls within this boundary, your probability is slightly elevated above the national average. It indicates that while you do not require extreme interventions, a “one-size-fits-all” approach is no longer protective enough. Specialists often recommend increasing the frequency of mammograms or starting them at an earlier age (such as 40) to catch any structural changes prematurely.
-
High Risk (Over 20%): This is the definitive threshold that answers the question, what is a high Tyrer-Cuzick score. A lifetime risk calculation of 20% or greater officially places a patient in the high-risk category. It is critical to remain calm if you receive this score; it does not mean cancer is inevitable. Instead, it serves as an early clinical trigger that unlocks access to advanced, intensive surveillance technologies that are normally unavailable to the general public.
┌────────────────────────────────────────────────────────────────────────┐
│                      TYRER-CUZICK RISK STRATIFICATION                  │
├───────────────────┬──────────────────────┬─────────────────────────────┤
│  RISK TIER        │  LIFETIME PERCENTAGE │  CLINICAL SURVEILLANCE MAP  │
├───────────────────┼──────────────────────┼─────────────────────────────┤
│  Average Risk     │  Below 15%           │  Standard Mammograms        │
│  Moderate Risk    │  15% to 20%          │  Early/Frequent Mammograms  │
│  High Risk        │  Greater than 20%    │  Annual Breast MRI + Mamm   │
└───────────────────┴──────────────────────┴─────────────────────────────┘
When a patient crosses into the high-risk zone with a score above 20%, her clinical roadmap undergoes a major upgrade. The standard mammogram is no longer considered the sole line of defence. Because dense breast tissue or subtle cellular changes can easily bypass traditional X-rays, the gold standard for high-risk care involves incorporating an annual breast MRI alongside regular mammography. Magnetic Resonance Imaging (MRI) does not rely on radiation; instead, it uses powerful magnetic fields to create highly detailed, fluid-sensitive cross-sections of the tissue, boasting a significantly higher sensitivity for catching early-stage abnormalities.
Understanding what is a high Tyrer-Cuzick score also empowers patients to explore proactive preventative measures beyond imaging alone. For women with an elevated Tyrer-Cuzick percentage, a clinical consultation can open the door to chemoprevention—the use of specialized medications like selective oestrogen receptor modulators (such as tamoxifen) which have been clinically proven to reduce the risk of hormone-receptor-positive breast cancers by up to 50%. Ultimately, this score shifts you from a position of passive waiting to active, strategic control, utilizing tools like an annual breast MRI to ensure your health is meticulously safeguarded.
Conclusion: Integrating Genetic Testing for Absolute Clarity
While mathematical models provide an invaluable starting point for estimating probability, an algorithm ultimately remains an exercise in statistical forecasting. Transitioning from a theoretical probability to absolute, definitive clarity requires looking directly at your unique molecular architecture, bypassing the guesswork entirely by integrating advanced diagnostics with statistical mapping.
The journey through advanced genomic science should never be walked alone. At London Genetics, we are dedicated to bridging the gap between clinical mathematics and the precision of modern genomics, replacing statistical averages with definitive, life-saving answers hidden within your own DNA.
Definitive DNA Discovery:
Undergoing high-resolution BRCA genetic testing to secure a definitive yes-or-no answer regarding major hereditary cancer syndromes, allowing for profound life decisions with total confidence.
Clinical Data Contextualisation:
Interpreting your mathematical risk scores alongside your broader medical history and multi-generational pedigree during a highly specialised consultation session.
Bespoke Surveillance Architecture:
Translating complex genomic findings into a highly personalised surveillance blueprint, determining exactly whether you require annual breast MRIs or advanced screening options.
Proactive Genetic Pathway:
Bypassing statistical averages by combining the predictive power of clinical algorithms with direct DNA sequencing of high-penetrance markers like BRCA1, BRCA2, and PALB2.
Definitive Health Control:
Stepping out of terrifying blanket percentages and mathematical uncertainty to take absolute control of your biological future equipped with elite clinical precision.